WIA BELIEVES | 2018 Q3 Vital Signs To Ponder
Recent volatility prompts us to take a look at the "FAANG" stocks, consider an Emerging Markets opportunity, and as always in Vital Signs, consider the value of investment asset class diversification.
FAANG - Following The Leaders - Nearly a decade into the post-2008 crisis era, this bull market has featured not just sizable returns and relatively little volatility (until the past six weeks), but strong leadership from a group of powerful, headline-grabbing companies, the “FAANG” stocks (Facebook, Apple, Amazon, Netflix, Google). Diversified portfolios broadly own these stock market darlings (and your funds likely have a good representation of them), but these more risk-managed portfolios are not structured overall to keep pace with the more volatile returns of any given stock. Investors can individually chase the hot names of course, but this can be at times both wise and unwise: FAANG stocks (like all stocks) are not immune from sharp, unpredictable losses (as shown). Nor is a concentrated bet on them likely to match the risk tolerance of most investors. While not reflected in this chart through the end of Q3, now six weeks into Q4 the FAANG index is down over 20%, with the line below touching to Q4 2017 levels.

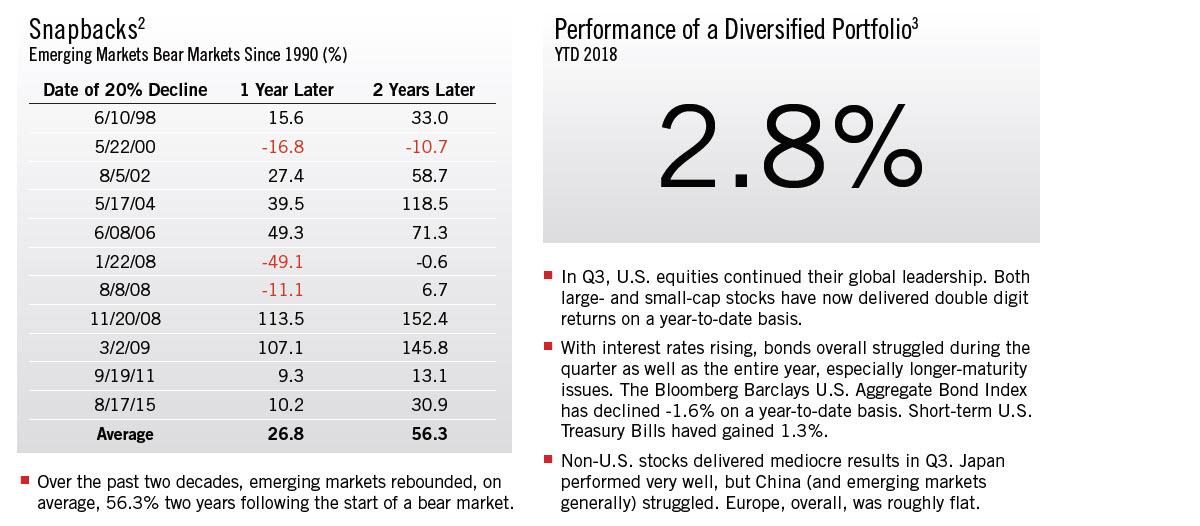
The Diversified Portfolio - A Place For Emerging Markets Equities?
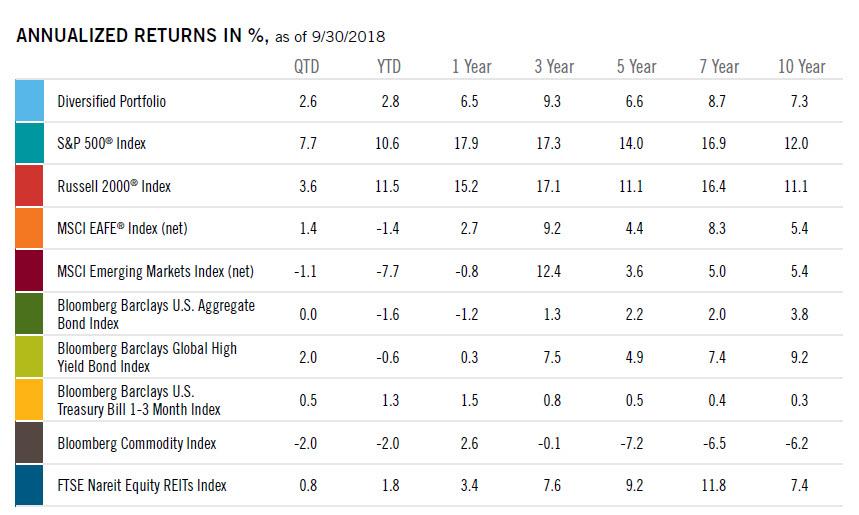
The Diversified Portfolio - Expectations and Realities - Asset Class Returns Through Q3 2018
Past performance is not indicative of future results.
1Source: Ned Davis Research.©2018 Ned Davis Research, Inc. Further distribution prohibited without prior permission. All rights reserved. See NDR disclaimer atwww.ndr.com/copyright.html. For data vendor disclaimers refer towww.ndr.com/vendorinfo.
2Source: Ned Davis Research.©2018 Ned Davis Research, Inc. Emerging Markets represented by the MSCI Emerging Markets Index. Period shown is 8/23/1990–9/26/2018.
3Source: Virtus Performance Analytics. See following page for composition and definitions.
The Diversified Portfolio assumes the following weights: 25% in the S&P 500®, 10% in the Russell 2000®, 15% in the MSCI EAFE®, 5% in the MSCI EM, 25% in the Bloomberg Barclays U.S. Aggregate, 5% in the Bloomberg Barclays U.S. Treasury Bill 1-3 Month Index, 5% in the Bloomberg Barclays Global High Yield Bond Index, 5% in the Bloomberg Commodity Index, and 5% in the FTSE Nareit Equity REITs Index. Assumes annual rebalancing. Data represents total return for stated period. The Diversified Portfolio is not representative of any Virtus portfolio. Investors should consult their financial professional to identify suitable portfolio allocations. There is no guarantee that a diversified portfolio will outperform a non-diversified portfolio, or that diversification among different asset classes reduces risk.
Index Definitions—TheMSCI World ex USA Indexcaptures large and mid cap representation across 22 of 23 Developed Markets (DM) countries, excluding the United States. TheS&P 500®Indexis a free-float market-capitalization weighted index of 500 of the largest U.S. companies. The index is calculated on a total return basis with dividends reinvested. TheRussell 2000®Indexis a market capitalization-weighted index of the 2,000 smallest companies in the Russell Universe, which comprises the 3,000 largest U.S. companies. TheMSCI EAFE®Index(net) is a free-float-adjusted market-capitalization weighted index that measures developed foreign market equity performance, excluding the U.S. and Canada. The index is calculated on a total return basis with net dividends reinvested. TheMSCI Emerging Markets Index(net) is a free float-adjusted market capitalization-weighted index designed to measure equity market performance in the global emerging markets. The index is calculated on a total return basis with net dividends reinvested. TheBloomberg Barclays U.S. Aggregate Bond Indexmeasures the U.S. investment grade fixed rate bond market. The index is calculated on a total return basis. TheBloomberg Barclays Global High Yield Bond Indexis a multi-currency flagship measure of the global high yield debt market. The index represents the union of the US High Yield, the Pan-European High Yield, and Emerging Markets Hard Currency High Yield Indices. The high yield and emerging markets sub-components are mutually exclusive. Until January 1, 2011, the index also included CMBS high yield securities. The index is calculated on a total return basis. TheBloomberg Barclays U.S. Treasury Bill 1-3 Month Indexincludes all publicly issued zero-coupon U.S. Treasury Bills that have a remaining maturity of less than 3 months and more than 1 month, are rated investment grade, and have $250 million or more of outstanding face value. In addition, the securities must be denominated in U.S. dollars and must be fixed rate and non convertible. TheBloomberg Commodity Indexis composed of futures contracts on physical commodities and represents 22 separate commodities traded on U.S. exchanges, with the exception of aluminum, nickel, and zinc. TheFTSE Nareit Equity REITs Indexis a free-float market capitalization-weighted index measuring equity tax-qualified real estate investment trusts, which meet minimum size and liquidity criteria, that are listed on the New York Stock Exchange, the American Stock Exchange, and the NASDAQ National Market System. The index is calculated on a total return basis with dividends reinvested. The indexes are unmanaged, their returns do not reflect any fees, expenses, or sales charges, and they are not available for direct investment.
Important Risk Considerations
Investing involves risks and the possible loss of principal. This report is based on the assumptions and analysis made and believed to be reasonable by the Adviser. However, no assurance can be given that the Adviser’s opinions or expectations will be correct. This report is intended for informational purposes only and should not be considered a recommendation or solicitation to purchase securities.
The FAANG stocks are in the technology sector.Industry/Sector Concentration: A fund that focuses its investments in a particular industry or sector will be more sensitive to conditions that affect that industry or sector than a nonconcentrated fund.Equity Securities: The market price of equity securities may be adversely affected by financial market, industry, or issuer-specific events. Focus on a particular style or on small or medium-sized companies may enhance that risk.Foreign & Emerging Markets: Investing internationally, especially in emerging markets, involves additional risks such as currency, political, accounting, economic, and market risk.Credit & Interest: Debt securities are subject to various risks, the most prominent of which are credit and interest rate risk. The issuer of a debt security may fail to make interest and/or principal payments. Values of debt securities may rise or fall in response to changes in interest rates, and this risk may be enhanced with longer-term maturities.High Yield-High Risk Fixed Income Securities: There is a greater level of credit risk and price volatility involved with high yield securities than investment grade securities.U.S. Government Securities: U.S. government securities may be subject to price fluctuations. An agency may default on an obligation not backed by the United States. Any guarantee on U.S. government securities does not apply to the value of the fund’s shares.Commodity-Linked Instruments: Commodity-linked instruments may experience a return different than the commodity they attempt to track and may also be exposed to counterparty risk.Equity REITs: The fund may be negatively affected by factors specific to the real estate market, including interest rates, leverage, property, and management.
